An Analysis Using Tableau, SQL, BigQuery, and R
Lauren Holstein
2023-11-01

Project Overview
Pokémon, the popular monster-collecting franchise, centers around fictional creatures that possess different stat values, including Attack, Defense, Hit Points, Speed, and more. Each Pokémon is also categorized as a Type, such as Water, Rock, Dragon, etc. There are hundreds of Pokémon, cataloged by these stats in the Pokémon dataset–or the Pokédex, as it’s called in the Pokéverse.
Problem
I’ve been hired by a Pokémon trainer to help them build a team with well-balanced stats.
My client wants to know which Type has the highest average stat in the categories of Attack, Defense, Hit Points, and Speed so they can choose one of each Type for their team.
They do not necessarily want to choose the Pokémon with the highest stat in each category for their team; instead, they would rather leave room for creativity and personal preference when it comes to choosing a balanced selection of Pokémon.
They would, however, like to know which Pokémon has the highest Attack rating from both the first generation of Pokémon and the overall Pokédex.
Data Overview
Source
I downloaded this dataset in spreadsheet format from Tableau’s selection of sample data. Pokémon sprite images were sourced from Pokemondb.net.
Data Limitations
The dataset does not contain all Pokémon as of 2023, but it was sufficient for my purposes of analyzing the earlier generations of Pokémon and creating visualizations.
Comparing Pokémon gets highly complex when you consider factors like Type matchups and move sets; for simplicity’s sake in this exercise, I am only considering the stats of Attack, Defense, Speed, and Hit Points as they relate to Type.
Data Analysis
Using Scatterplots to Compare Types
Through my analysis, I wanted to determine how different Pokémon Types compared in stats. Using Tableau, I created visualizations and dashboards that displayed various aspects of the Pokémon dataset grouped by Type.
To easily compare Types, I created scatterplots in Tableau.
There are 18 different Types of Pokémon; including all of them on a single visualization made it too busy, so instead I compared several Types at a time to gain a high-level idea of how the different stats compared.
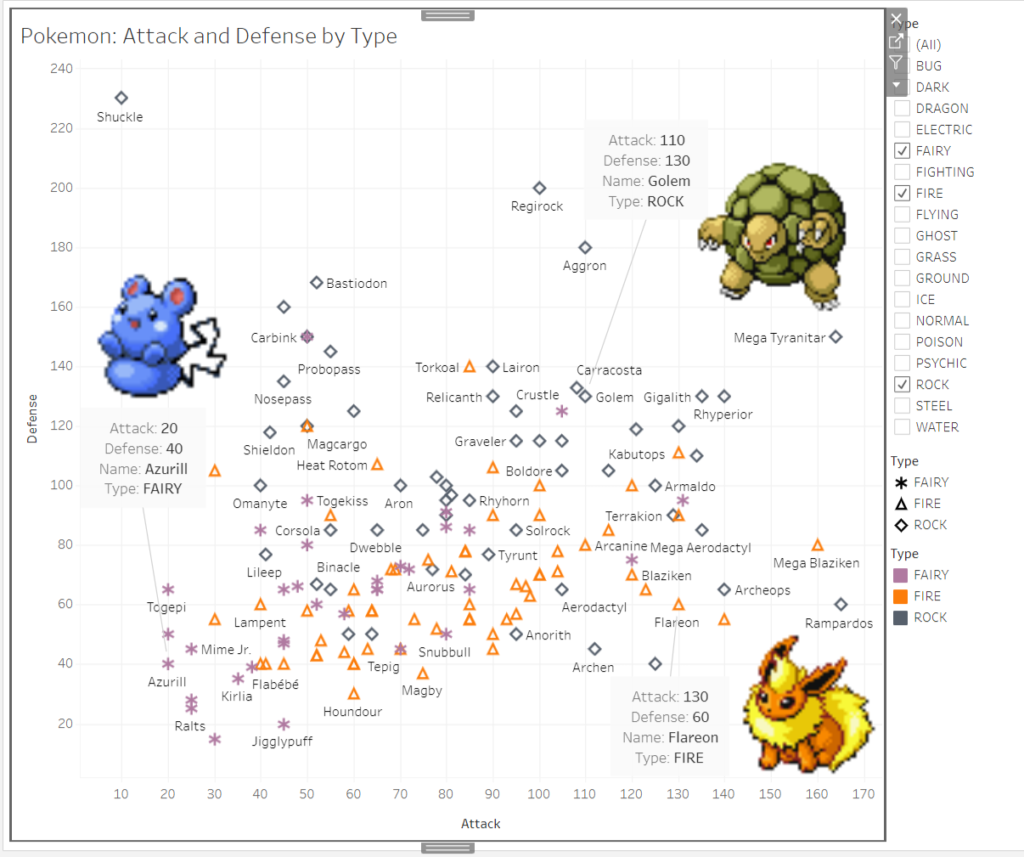
For example, the plot above compares the Attack and Defence stats of Rock, Fire, and Fairy Types. This plot showed that Rock Types tend to have higher Defense, Fire Types tend to have higher Attack, and Fairy Types tend to be weaker in both.
For flavor, I chose one Pokémon from each Type and added their sprite images and stats to the dashboard.
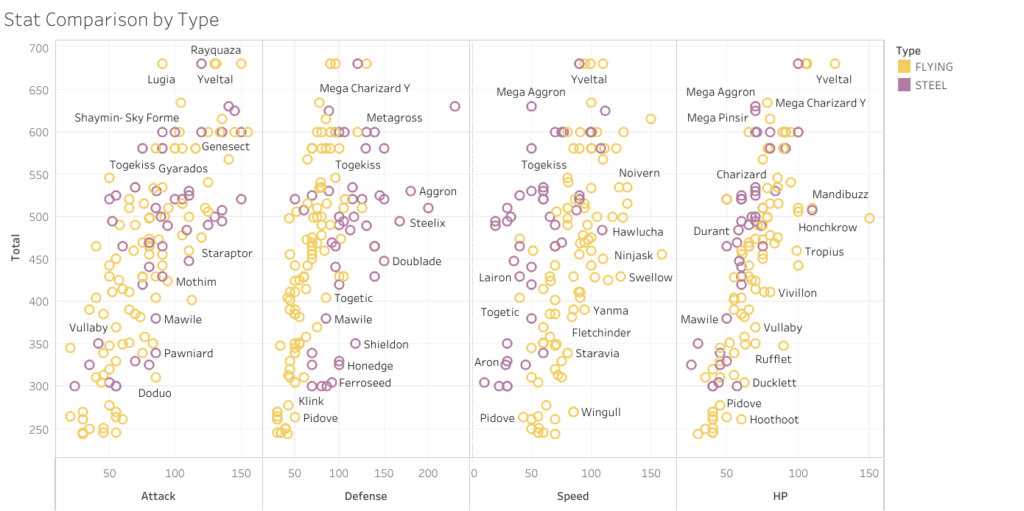
As another example, the plot above charts Attack, Defense, Speed, and Hit Points against the Pokémon’s summed total stats. This chart compares Flying and Steel Types. At a glance, you can tell that Steel has a higher average Defense, while Flying has higher average Speed and Hit Points.
This plot also indicates which Pokémon of the Steel and Flying Types are the strongest and weakest overall; Pokémon with the highest summed stats are at the top of the y-axis while the weakest are at the bottom.
Digletting into the Data with SQL

I wanted to analyze the Pokémon dataset in greater detail, so I uploaded it as a new dataset and table in BigQuery.
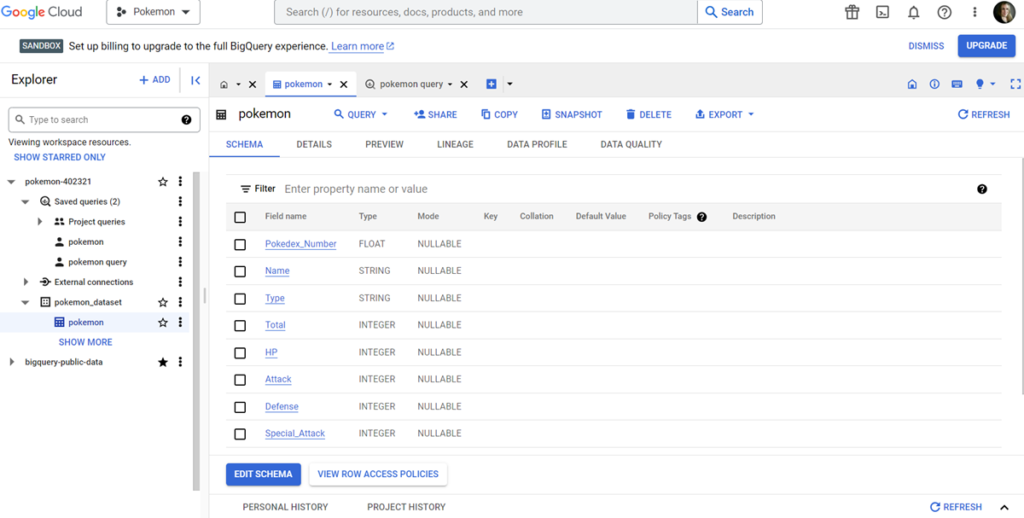
Uploading the data into a queryable database like BigQuery allowed me to easily find the information I needed using SQL queries.
Finding the Highest Attack Rating
My client wanted to know which Pokémon had the highest Attack rating. I was able to discover this using queries in several ways:
#1: Sorting the entire dataset by Attack rating:
SELECT  *
FROM `pokemon-402321.pokemon_dataset.pokemon`
ORDER BY
 Attack
 DESC
The asterisk * indicated that all columns would be returned in the query, while DESC returned the Pokémon with the highest Attack rating first, followed by all others in descending order.
#2: Using the MAX function to identify the Pokémon with the highest Attack.
SELECT  MAX(Attack)
FROM `pokemon-402321.pokemon_dataset.pokemon`
This returned a max Attack rating of 190; a follow-up query returned the associated Pokémon.
SELECT  *
FROM `pokemon-402321.pokemon_dataset.pokemon`
WHERE
 Attack = 190
The Pokémon with Attack rating 190 is Mega Mewtwo X, a later-generation addition to the Pokédex.
Filtering the Dataset
The queries above identified the highest Attack rating in the entire dataset. But what if I wanted to find the highest Attack rating out of only the original generation of Pokémon (#1-151)?
To analyze a subset of the data, I used SQL functions to filter out the information I didn’t need.
In this dataset, Pokémon evolutions added in later generations have decimals in their Pokédex numbers. For example, the Pokémon named Mewtwo exists in the original set as number 150; Mega Mewtwo X, a later addition, is in this dataset as 150.1.
To look at only the original 151 Pokémon, I needed to filter out non-whole numbers from the dataset. To do this I used the FLOOR function, which returns the largest nearest integer to the given value. For example, FLOOR(3.14) returns 3.
Here is the query I used to compile a list of only the original 151 Pokémon:
SELECT  *
FROM `pokemon-402321.pokemon_dataset.pokemon`
WHERE
 Pokedex_Number = FLOOR(Pokedex_Number)
 AND Pokedex_Number <= 151
ORDER BY
 Pokedex_Number
The FLOOR function returned only whole numbers from the Pokédex and the second condition returned only Pokémon #1-151.
Next, I used ORDER BY to identify the original-gen Pokémon with the highest Attack rating:
SELECT  *
FROM `pokemon-402321.pokemon_dataset.pokemon`
WHERE
 Pokedex_Number = FLOOR(Pokedex_Number)
 AND Pokedex_Number <= 151
ORDER BY
 Attack
 DESC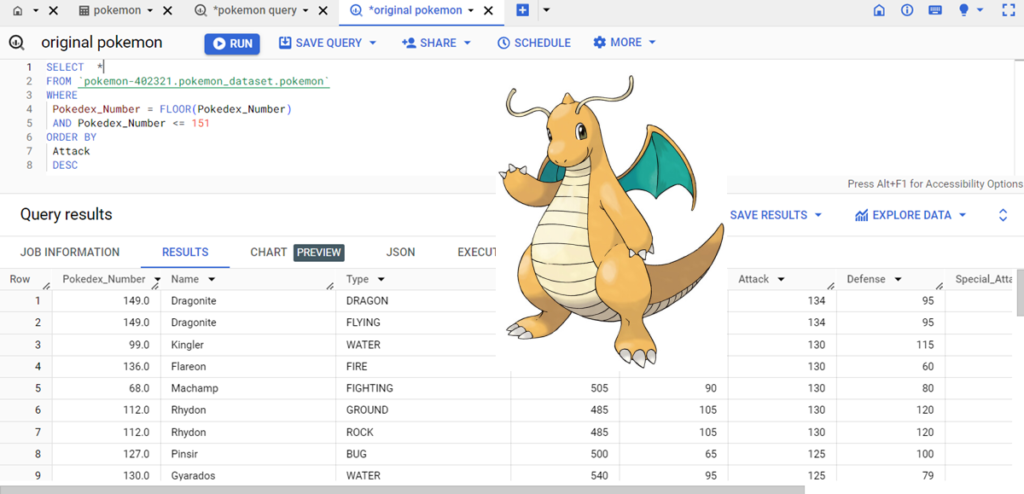
The original-gen Pokémon with the highest Attack rating is Dragonite with an Attack of 134.
Comparing Averages with Bar Charts
I also wanted to look at the entire dataset and compare averages for Attack, Defense, Hit Points, and Speed for each Pokémon Type. To visualize the comparisons, I made bar charts in Tableau.
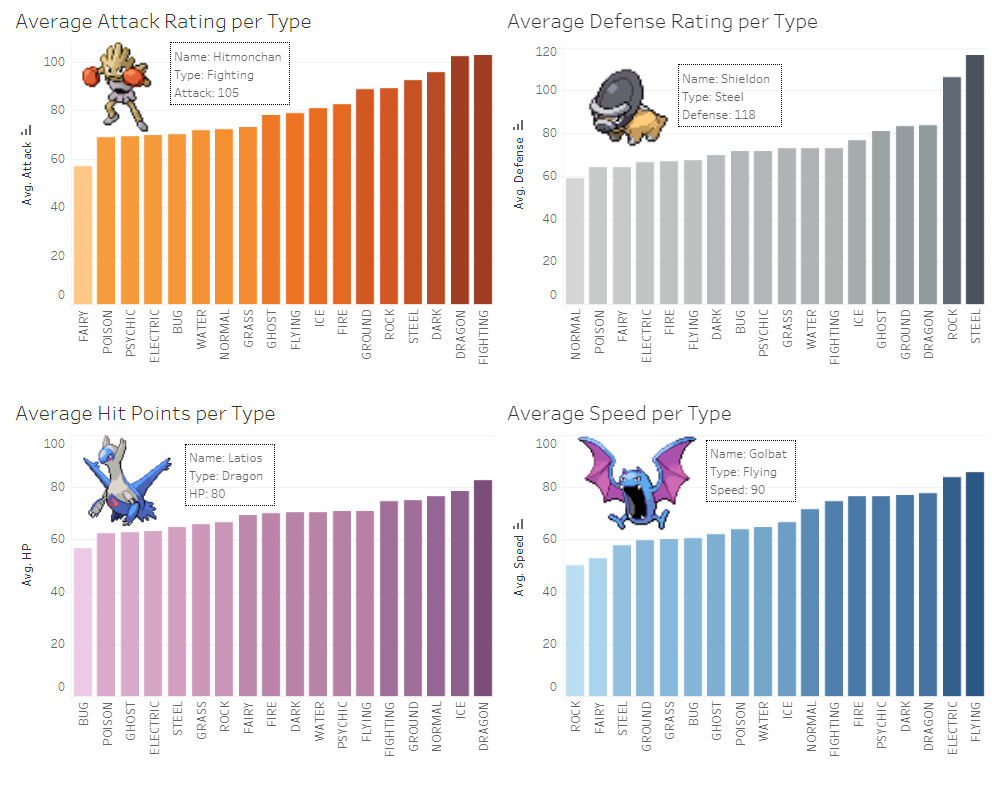
To make the charts more visually interesting, I added a sprite image of a Pokémon belonging to the type with the highest average for each stat. I wanted the Pokémon I chose to have a stat that was close to the average for its type. To find appropriate Pokémon for each chart, I used a SQL query.
For example, the type with the highest average defense is Steel. Steel Pokémon have an average defense of 116, so I searched for a Steel Pokémon with a defense in the range of 111 to 121 (a range of 10 with plus/minus 5 on each side of the average):
SELECT *
FROM `pokemon-402321.pokemon_dataset.pokemon`
WHERE
Defense BETWEEN 111 AND 121
AND
Type = "STEEL"
This query returned 6 Pokémon that fit my criteria, and I picked the one that I thought had the most fun aesthetic.
I repeated this process for each stat average:
Reporting My Analysis with R Markdown
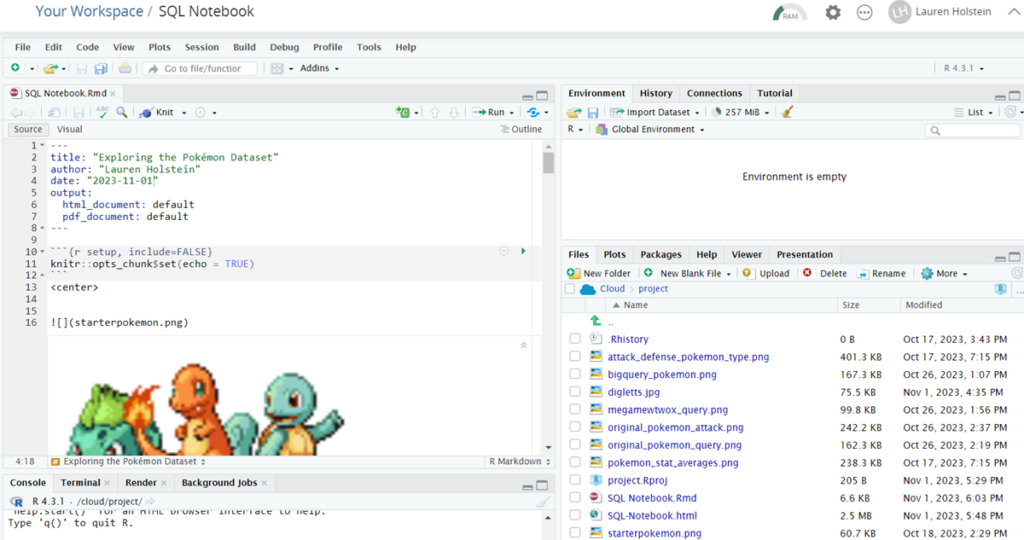
As a final step, I chose to report my analysis findings by creating an R Markdown document in RStudio. I like R Markdown because it’s simple but versatile and allows me to generate reports in different formats. I knit the report into HTML and loaded it onto my online portfolio at laurenholstein.com.
Key Takeaways
Analyzing the Pokémon dataset was a fun and useful way to practice several of the skills I learned while completing the Google Data Analytics Professional Certificate, including:
- Creating data visualizations such as scatterplots and bar charts using Tableau
- Performing SQL queries
- Sorting and filtering data using SQL queries
- Creating reports from data analysis results using R Markdown
By using SQL, Tableau, and R, I was able to practice my data analysis skills and generate the following recommendations for my client.
Recommendations
After my analysis, I had the insights I needed to recommend a well-balanced Pokémon team to my client.
Their team should consist of one Pokémon from each of the following types:
- Fighting (highest average Attack)
- Steel (highest average Defense)
- Dragon (highest average Hit Points)
- Flying (highest average Speed)
- Mega Mewtwo X, while having the highest Attack rating in the whole Pokédex, is an incredibly rare Pokémon. Instead, I recommend my client catches a Dragonite for their team, which has the highest Attack rating of any first-generation Pokémon.
Header photo by Daniel Bernard on Unsplash.

